Officials say CSIR-developed dashboard helps direct traffic and rapid response
CSIR researchers developed a dashboard and mapping tool to assist Limpopo’s Department of Transport and Community Safety (DTCS) with data-driven service delivery. The tool, now handed over to the province, gives officials a bird's-eye view of road incidents like crashes, pedestrian-related accidents, taxi transport patterns and speeding.
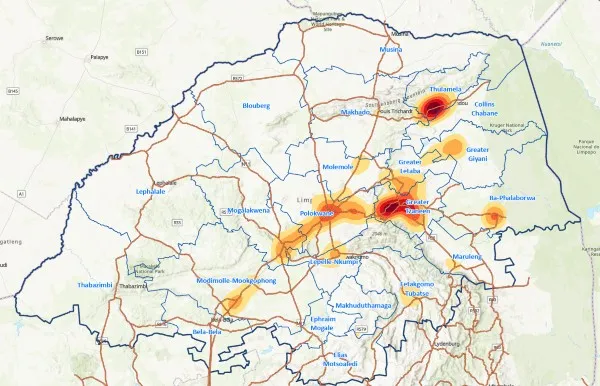
Johan Maritz, an urban planning and geospatial (mapping) expert at the CSIR, says the tool is hosted within the Office of the Premier, which has access to a sophisticated Geographic Information System environment capable of hosting this type of digital geospatial portal.
"Traffic officials have always been collecting coarse road incident data, but they were not spatialising it," says Maritz. Maritz worked with other experts and partners to turn existing fragmented road incident data into maps and charts that are easily accessible on a single digital dashboard.
Prudence Mashige, a provincial inspector within the Traffic Information System unit of Limpopo DTCS, says her team checks the new dashboard weekly to report on trends and make operational changes.
"One of the most shocking patterns the maps have revealed so far is the number of pedestrians who are killed in areas around liquor outlets," she says. "We have seen, for instance, many instances of pedestrians entering a public road in an unsafe area while intoxicated."
She says that, besides being easy to use and indispensable for daily decisions, the best part about the dashboard is that whenever a new issue arises or her team observes a particular trend, more data layers can be added to the map or information can be combined with other data tools to support law enforcement efforts as a whole.
In the case of pedestrians at risk near liquor outlets, for instance, she says her team was able to add this data layer to the existing tool developed by the CSIR. An important next step, she adds, is for other law enforcement agencies to identify and close any illegal operations.
Mashige says the tool has also revealed patterns in road deaths associated with cross-border vehicles, which again presents an opportunity for data sharing to enable border control. Cross-border vehicles are vehicles that may have entered Limpopo from outside the province, including vehicles registered in neighbouring countries and travelling within South Africa.
The dashboard also helped determine where resources are most needed during the annual Easter pilgrimage to Moria, situated east of Polokwane along the R71 road. It is one of the largest religious gatherings in the world.
"We have also seen trends that led us to establish a permanent 24-hour N1 brigade to patrol the highway and we now know that the peak time for road incidents starts at about 2 pm on a Thursday and continues throughout the weekend," she says. "In other areas where there are few or no incidents recorded, we have reduced the number of officers."
In the spirit of mutual support and cooperation between the Premier's office and the Limpopo DTCS, Maritz says the CSIR was requested to assist with an initial proof-of-concept dashboard in 2023.
"They realised that analysing their existing data in a more processed, spatialised way would assist them in targeting their efforts and limited resources more effectively to deal with the high rate of road incidents," he explains. "They wanted the dashboard as a tool to support planning, such as how and where to allocate resources, dealing with traffic risks at specific locations or during certain times of the year and generally identify high-risk areas.
At the same time, he says, the CSIR team was given the freedom to experiment with and build other useful functions and data layers into the dashboard, such as the locations of emergency response stations and station-based travel times.
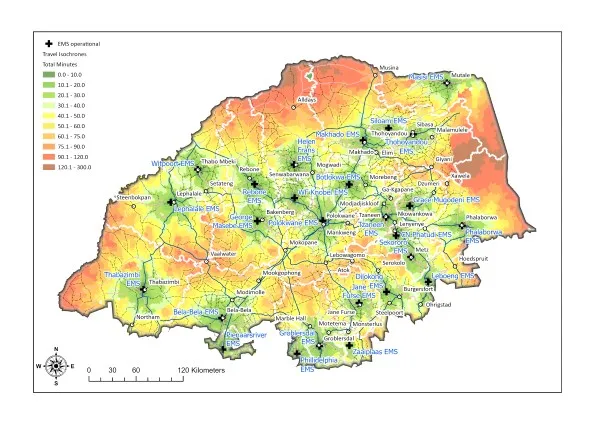
Maritz explains that officials can now use the dashboard to filter road incidents by vehicle type, location (routes) or heavy traffic seasons, such as Easter or the Christmas holidays. They can also see how accessible incidents were to emergency responders in terms of travel time from a response station.
Maritz says that when officers respond to an incident, they usually write down information on paper or enter it into a spreadsheet or information system afterwards. Mistakes can creep in, so he suggests that the next step for local government departments looking to digitise and drive decisions based on data will be to modernise on-the-ground data capture.
“In today's world, we have cell phones and you can very easily get an XY coordinate when you are standing at an accident site, for example,” he says. “A road incident mobile application for officials to capture information that directly feeds into the dashboard would be ideal and would improve accuracy.”
Maritz says it is important for the public, as well as other local government departments that are thinking of adopting a similar tool, to know that personal and sensitive data, such as the names of individuals, are anonymised before being processed for the dashboard. The dashboard is not intended to identify people or vehicles involved in road incidents, but rather to reveal trends, patterns and hotspots that would have been hidden had the data remained on paper.
He adds that the dashboard is just one aspect of the much larger Limpopo Road Safety Strategy and Action Plan, for which the CSIR is the technical lead. The plan originated during a project to address social issues in mining communities by Impact Catalyst, a not-for-profit initiative of Anglo American, Exxaro, the CSIR and World Vision South Africa.
"We would like all partners in the province to share interventions like this road incident dashboard with other provinces as well," says Maritz. "The point here is saving lives and the issues are bigger than just data on a map. If this tool helps reduce incidents and save lives, we have achieved a lot."
He says that the approach taken in Limpopo could be valuable to every province in South Africa and that the CSIR is ready to support local government with technology and innovation for better road safety.
"I must say the dashboard is really working for Limpopo and it helps us to advise districts on deployment and the movement of resources where they are needed most," adds Mashige.
Visit https://www.csir.co.za/what-we-do/mobility-and-logistics or email @email for more information.
Published 15 September 2026